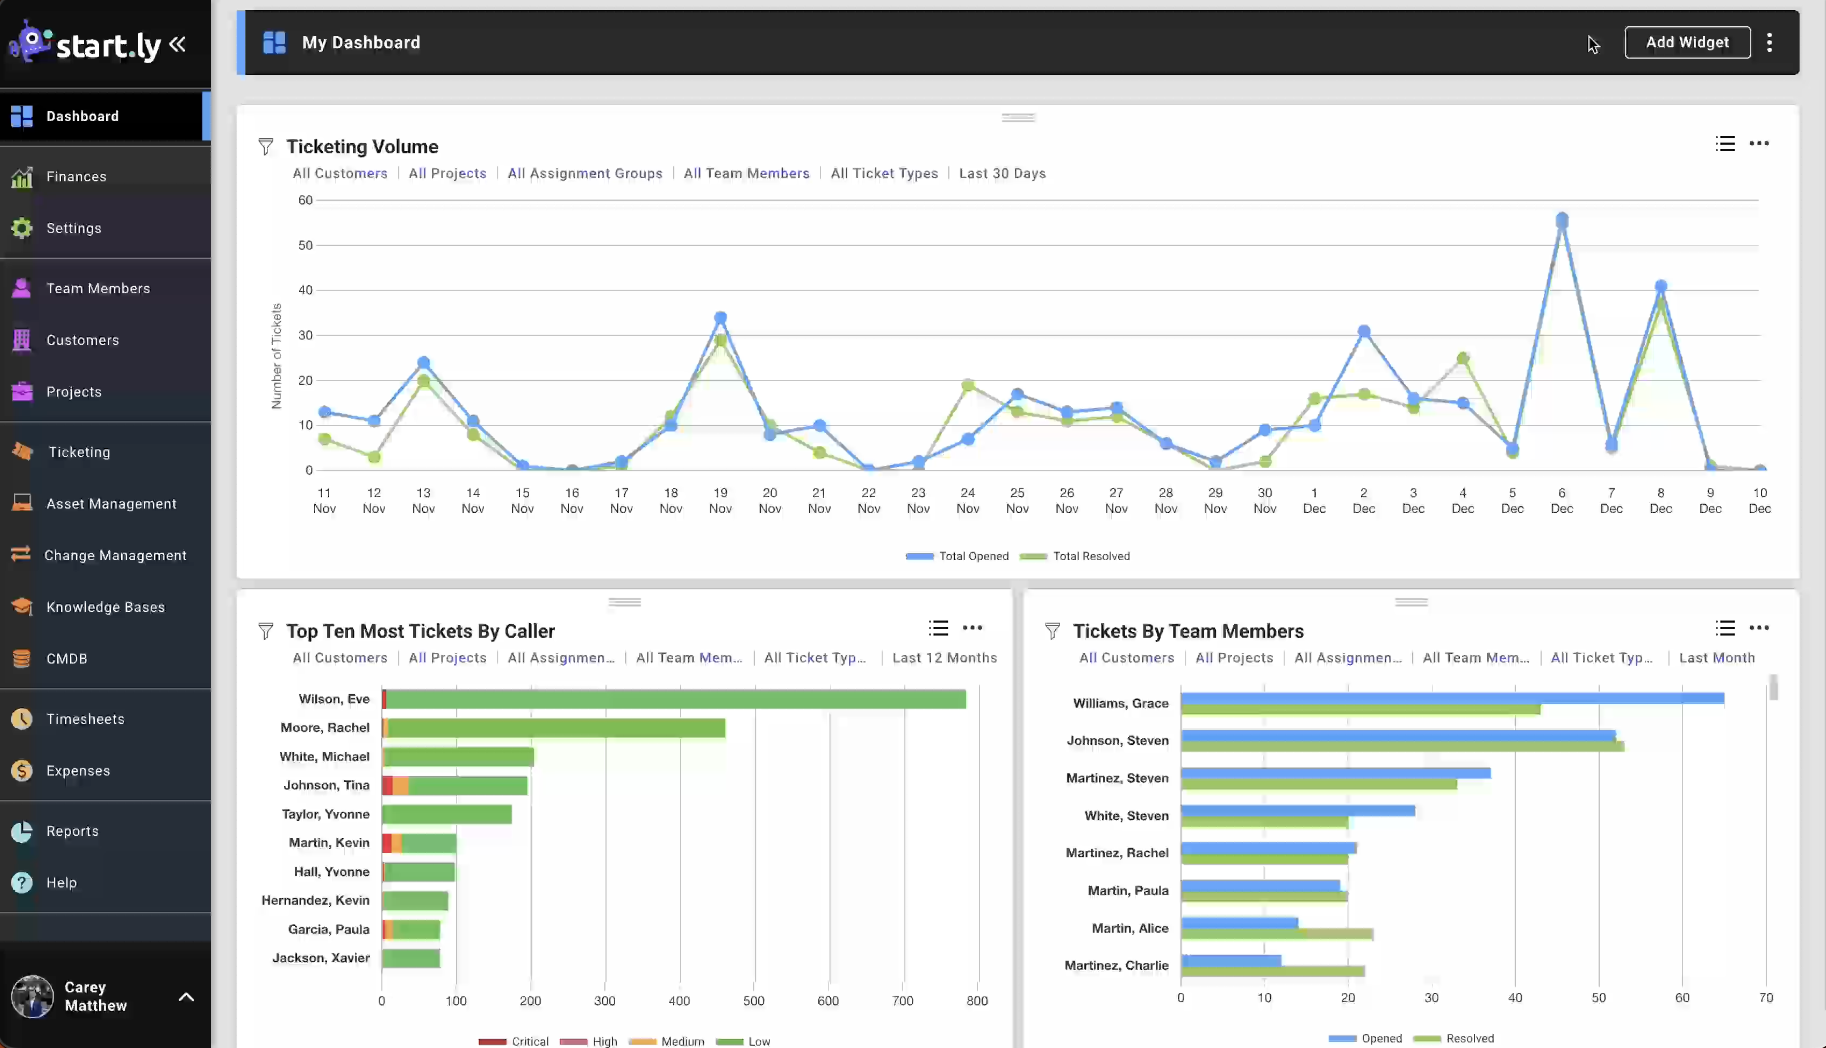
Performance analytics
Enable data-driven decision-making throughout your IT ecosystem. Startly gives you real-time visibility into performance and results across projects, resources, and service delivery, in an easy-to-read dashboard with a built-in budget tracker.
One source of truth
Your custom dashboard shows you what’s going right and where you need to intervene. Forget the long hours of poring over reports – Startly’s performance analytics show you every piece of information you need to know.
Get real-time visibility
You get a visual snapshot of performance, focused on your unique KPIs, in real time. Report on your successes or intervene ASAP to get a project or system back on track.
Role-based custom dashboard
Show only the data you need to know on your dashboard or add in the nice-to-haves. Each person can tailor their dashboard to show the data they need to do their job better, from SLA compliance to project performance.
Customize a project-level dashboard
See specific, project-level performance: time spent, tasks completed, and resource use. A budget tracker template is built in. This is the easiest way to help project managers track scope, timeline, and budget in one place.
Choose your widget
Startly includes a pre-built set of dashboard widgets that can be easily customized to display your data in the most user-friendly way. Get easy-to-understand visuals. No coding required.
Drill down right in each widget
It just takes a click to drill down to the underlying data and details. Every piece of data you need is available just by clicking in each widget. Since when did analysis get so easy?
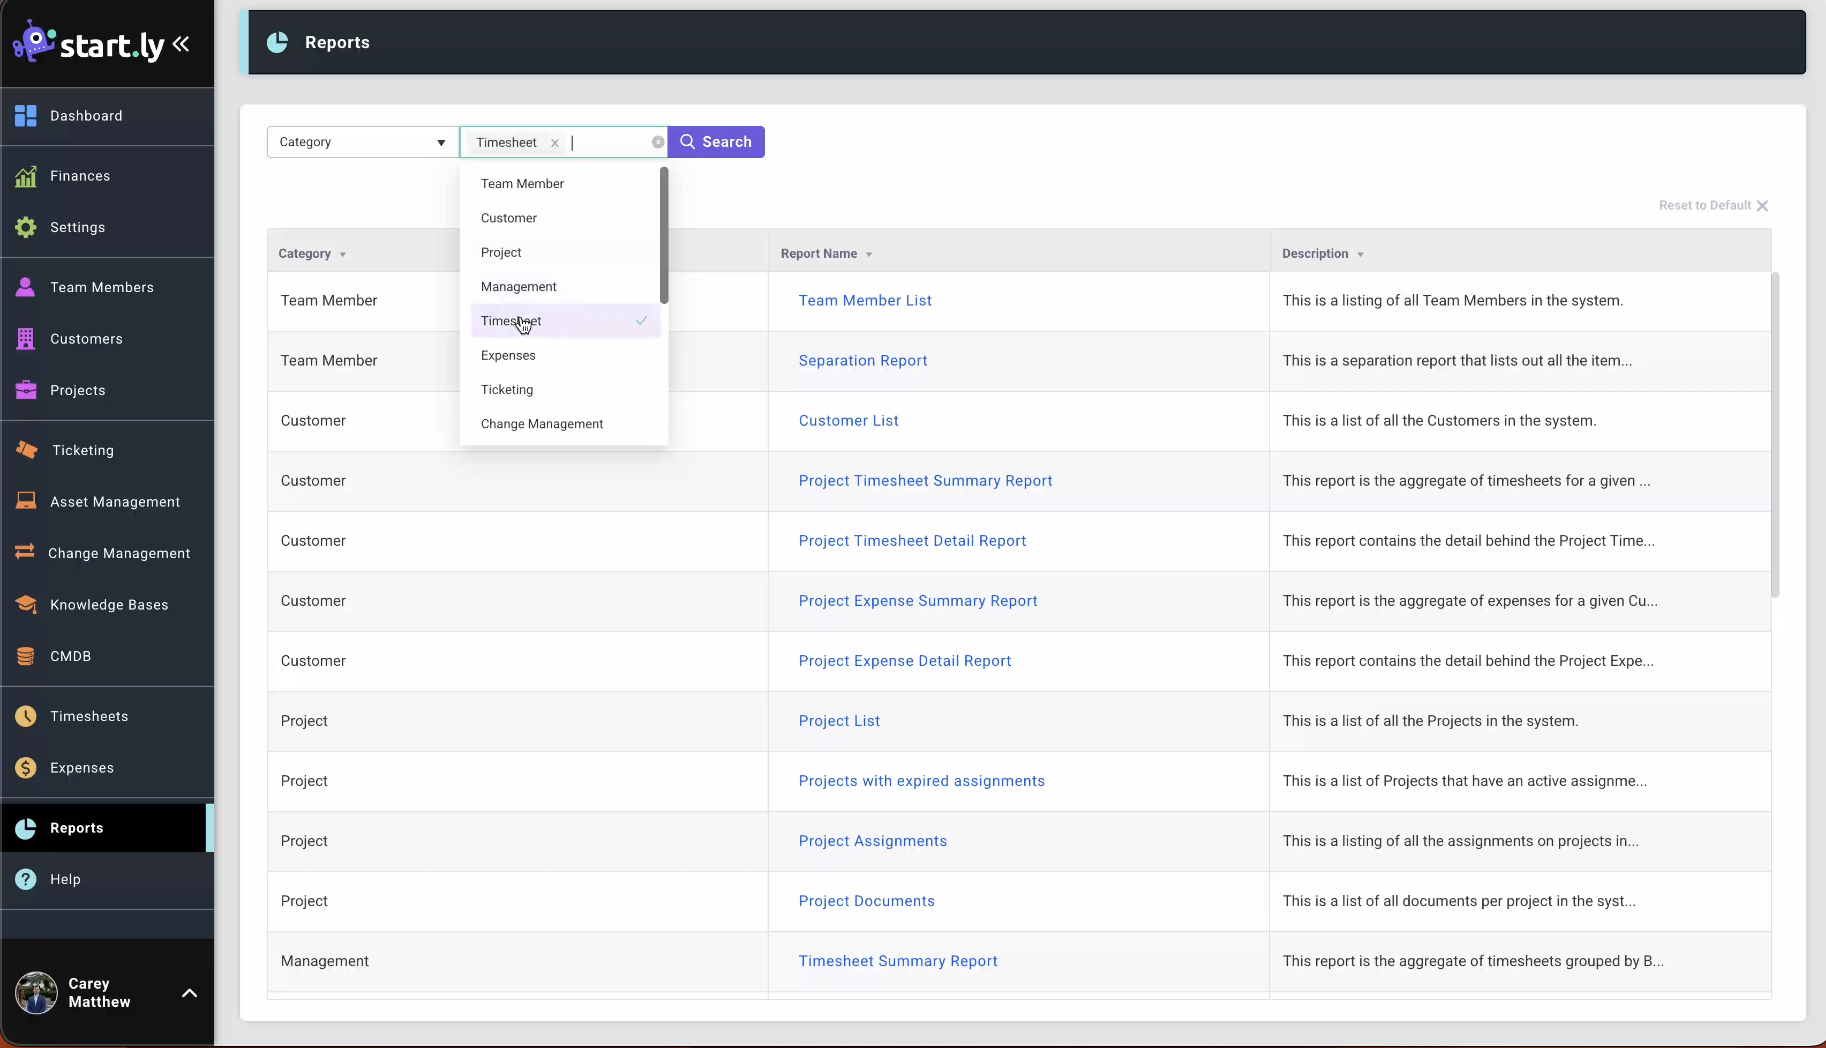
Any report you need
Startly was built with performance in mind. You get data-rich reports and exportable dashboards to help you monitor performance, ensure accountability, and support data-driven decision-making. It makes reporting up quick and easy.
Reports show all critical operations
Here’s the short list:
- Ticketing and SLAs: measure open and closed tickets and response and resolution performance.
- Project management: track task progress, time vs. budget, and burn rate.
- Resource utilization: see planned capacity vs. actual and billable vs. non-billable time.
- Time and expenses: monitor submission rates, approval cycles, and billing readiness.
- Financials: track forecast vs. actual revenue and profit margins.
Easily report to your management team, recognize top performers, and intervene fast before a project or team goes south.
Role-based reporting
Administrators can check organization-wide reports on elements like time tracking, resource utilization, billing, and expenses. They can access project reports and drill down by team, service line, or location. They can also see license and user activity reports for governance. This gives them oversight and control over the full IT ecosystem.
Business unit managers can customize department-specific dashboards that show resource allocation and project delivery, SLA and ticket compliance by customer or function, and budget tracking and profitability for their business unit. Better reporting means better accountability and performance.
Still on the fence?
See Startly in action—book a quick demo with one of our experts. In 15 minutes, you’ll know if it’s the right solution for your team.